Kabra Extrusiontechnik had a bad FY12 financially due to slowdown in Indian polymer consumtion growth. Construction pipes and FMCG packaging oriented polymer consumption is expected to resume it's growth in FY13 and so the growth of Kabra Extrusiontechnik. Does this makes it a stock to buy in 2012?
BUSIENSS
As stated, The polymer consumption in plastic pipes for irrigation, water management, construction, telecom industries and packaging films for edible oils, milk, processed foods and other FMCG products is expected to show healthy growth in FY13 and beyond. Kabra Extrusiontechnik (KETL) is India's leading manufacturer of heavy machinery/plants for plastic processing industry to produce plastic pipes and packaging films. The expected growth will ensure demand for products of company.
Industry experts believe that investment of nearly $10 billion would be required in the plastic processing industry to meet the future demands. Such big investments in the plastic processing industry will be a key growth driver for sector and so for the company.
The company has set up one more manufacturing unit at Daman with investment of Rs.35 crores for new products. This additional capacity will be available from FY13 onwards.
Kabra extrusion has paid dividend consistently for last 7 years in a row. It's current stock dividend yield stands at healthy 5.17%.
STOCK FINANCIALS
KETL's profits plunged 75% against a 14% fall in its net sales in first three quarters of FY12. This was due to investment in new plant in Daman and increased expenditure due to hike of 30% in local electricity rates. Company's revenues have grown at a CAGR of 16.9% with profit growth at 32.5% in the five-year period ended FY11. Its debt-equity ratio at end September 2011 is at 0.1.
STOCK VALUATIONS
The stock trades at current stock price of Rs.34. The price-to-earnings multiple (P/E) is at 11.67 and price-to-book value ratio (P/BV) of 1.01. The board has recommended dividend of Rs. 1 per share for 2012 which makes dividend yield at 3% which is not bad. Looking at growth prospects and limited downside, it is a good small cap stock to buy at dips and wait for a year or two to get good investment returns.

Showing posts with label Manufacturing Sector. Show all posts
Showing posts with label Manufacturing Sector. Show all posts
Buy Stocks of Sesa Goa for medium term
Equity research team of Nirmal Bang is bullish on Sesa Goa has recommended to buy stocks of Sesa Goa for medium term. Here is the stock research report.
Sesa Goa’s (SGL) annual report for 2011-12 indicates that company’s management is cautiously optimistic on the iron ore market. It may be recalled that Sesa Goa faced multiple headwinds like iron ore production as well as export ban in Karnataka, logistics issues in Goa and declining iron ore prices.
Iron ore prices are not looking to be on higher side in near future but above sectoral issues may not be resolved soon. Sesa Goa is an insignificant play in the combined merged entity i.e. Sesa-Sterlite.
The combined entity’s valuation (a major portion of the valuation is driven by Cairn India and Hindustan Zinc) is high and with these valuations, target stock price for Sesa Goa will be Rs.230 in medium term.
Buy stocks of Electrosteel Castings for one year
Here is the Result Update on Electrosteel Castings for 4QFY2012 with a 'Buy Stocks' recommendation and target stock price for next 12 months.
The results of Electrosteel Castings (ECL) for 4QFY2012 were disappointing. The company’s EBITDA and net profit were negatively affected due to higher raw-material and interest costs.
The stock research team at Angel Broking has positive view on the company’s initiatives of venturing into steel making through its associate Electrosteel Steels (ESL).
Further, the company’s backward integration initiatives through the allocation of iron ore and coking coal mines are expected to result in cost savings from FY2014.
The stock research report recommends to Buy stocks of Electrosteel Castings (ECL) with target stock price of Rs.22 in next 12 months.
ELGI Equipments - Small Cap Stock Analysis
ELGI equipments is one of the largest player and a manufacturer of air compressors and automobile service station equipments.
ELGI's products are used in a wide range of applications in areas ranging from mining, defense, transport, pharmaceuticals, power, oil, railways, chemicals, textiles, printing to ship building, paper, electronics, telecommunications, medical, food & beverages and plastics.
The company has been keen in pursuing new business opportunities and has been highly adaptable to new technologies. ELGI already leads India in compressor technology and is a prominent player in Automotive Service Station Equipment. Engines and ELGI New Generation Compressors (low range reciprocating compressors) are today emerging as new business sectors for the company.
ELGI's global presence has been a result of international customers recognizing ELGI as a purveyor of technologically superior products. ELGI's success in the international market is further evidenced by the fact that a large portion of the international business comes from repeat sales to established customers. Today ELGI has a presence in all the major markets across the world covering Europe, North America, Latin America, Africa, Australia, Middle East, South East Asia, West Asia and the Far East.
Elgi is the market leader in air compressors (over 10 per cent) as well as automobile service station equipment and is also among the larger players in Asia. ELGI caters to the needs of various business segments and this extent of diversification has allowed Elgi to keep up growth momentum. Elgi has utilised the slowdown period to test grounds and ramp up presence in the Brazilian and Chinese markets. In Brazil, where the company's products have for long had takers, the company has set up a wholly-owned subsidiary as a trading unit.
ELGI also has a manufacturing plant in China and has trading presence. There is a very good scope for ELGI's products in China due to the huge size of China's manufacturing capacity. However, the development in China and Brazil could take sizable amount of time to make reasonable contributions to the bottom line. Elgi products' application in the oil sector has also given it a market in West Asia.
Market Cap 695.09
* EPS (TTM) 6.86
* P/E 12.97
* P/C 11.31
* Book Value 25.40
* Price/Book 3.50
Div(%) 130.00
Div Yield(%) 1.46
Market Lot 1.00
Face Value 1.00
Industry P/E 19.47
* as per latest stock financials
Elgi' sales grew at 20 per cent compounded annually (to Rs 595 crore in FY-09) over the last three years, while profits expanded by 25 per cent over this period. Operating profit margins, though healthy at 12 per cent levels, could come under pressure as a result of hike in cost of steel and copper.
It's an small cap stock for long term investment portfolio at current stock valuations.
Stock Analysis - Pidilite Industries
Pidilite Industries Ltd is a classic all-weather stock to buy that must be bought on severe market declines.
It reports excellent revenues and profits, year after year, has a suite of impregnable brands which it nurtures well, is a fine domestic consumption play, is run by smart promoters—and is usually expensive, which is why it should be bought when the market sells off crazily.
Pidilite is the leading manufacturer of crafts materials, adhesives and glues, DIY (do-it-yourself) products and industrial specialty chemicals in India. Its flagship brand, Fevicol, is the largest selling synthetic adhesives brand in India. Pidilite operates in two main segments—consumer/bazaar products and industrial products. The consumer and bazaar segment includes products like adhesives, sealants, art materials, construction chemicals and paint chemicals. This segment contributes more than 70% of its revenue. The industrial product segment includes industrial adhesives, synthetic resins, organic pigments, pigment preparations and surfactants. These are consumed by various industries including packaging, textiles, paints, printing inks, paper and leather.
The key driver to sales and earnings growth for Pidilite is the steady increase in the proportion of branded products with a clear edge in the marketplace. Pidilite has powerful brands like Fevicol, Steelgrip, Acron, Dr Fixit, Fevitite M-seal (acquired from Mahindras), Fevistik, Fevikwik, Fevibond, Piditint, Fevicryl, Prime, Ranipal (acquired from Mafatlals), etc, pushed through a marketing network of 40,000 dealers and over 400,000 retail outlets—an unmatched promotional and distribution reach. It is also known for a series of terrifically humorous TV commercials that lift the profile of its mundane, utilitarian products, especially adhesives.
While Pidilite has so far been focused on chemicals and, within that, different versions of adhesives, it did the unthinkable and launched a snack food called Chikkers. Chikkers were a kind of sweet crispies that were positioned as a health snack but sank without a trace. Its idea of creating a retail chain of Hobby Ideas to sell art materials and many of its own products under one roof in an attractive promotional environment has not worked either. The good thing is that the management is slow to commit funds to such experimental ideas and quick to pull the plug when they don’t work. Pidilite is uniquely placed due to its strong market position, product innovation, a wide distribution network, its ability to exploit brand loyalty and increased demand due to the construction boom. It also exports its products to over 50 countries including Brazil, South Africa, Egypt and USA and to countries of the Middle East and Europe. In FY09, exports accounted for about 26% of the total revenue.
A key issue with Pidilite is its susceptibility to swings in raw material prices. When raw material costs shoot up, margins are squeezed and the stock, which has low institutional ownership and following, stagnates or falls. The past two quarters have been great because raw material prices were low. In Q2FY10, net profit was up by 240%. Operating profit for the September quarter, at Rs119.59 crore, was the highest ever, even though margins will go down in the coming quarters as raw material prices have risen. On the other hand, topline growth will be higher, thanks to increased construction.
The Pidilite stock is never cheap and sports a P/E of around 14 on FY10 net profit. Buy stocks of Pidilite at around Rs 150 for long term investment portfolio.
Checkout: Stocks To Buy For 2010 - Let's Share Ideas
Go back to: Stocks To Buy Now For 2010 Investment Portfolio
Goodyear India - A Good Mid Cap Stock To Buy
A 74% subsidiary of Goodyear Tire & Rubber Co. US, Goodyear India is among the best-known tyre brands. It has a very wide product portfolio including tyres for passenger cars, commercial vehicles, trucks, buses, tractors and earthmovers.
The tyre sector has been doing extremely well for quite some time now with lower input costs fuelling bottomline. This, in turn, has helped the component manufacturers to improve their performance on the back of higher demand.One problem with Goodyear is its margin. Operating margin and net margin over the years has been extreamly low at sub single digit respectively. This leaves it vulnerable to even a slight fall in revenues or a rise in cost.
Market Cap 420.04
EPS (TTM) 19.48
P/E 9.35
P/C 7.48
Book Value 68.20
Price/Book 2.67
Div(%) 60.00
Div Yield(%) 3.29
Market Lot 1.00
Face Value 10.00
Industry P/E 16.96
It has been expanding years after years to cope with the higher demand. That apart, it also plans to set up hundreds of exclusive outlets in the next few years. Valuations look attractive and with the tyre sector having a dream run on the bourses, goodyear may just be one of the best sectorial performer in the days to come.A hot stock to buy at dips.
Best Stocks From Cement Sector
Revival in the economy and increased government spending in the infrastructure sector has given a boost to the cement companies. In fact, since March, when the upward rally started, cement companies appreciated more than 120% against around 80% appreciation of the Sensex. In the past few months, coal and petcoke prices have also corrected substantially, which helped in reducing the input costs. Here is a list of top 10 stocks from cement sector published in Economic Times.
LARGE CAP STOCKS
Recommended By: Indiabulls Securities & Emkay Global Financial Services
GRASIM INDUSTRIES
CMP: Rs 2723
For the year ended March 2009, Grasims consolidated revenue increased 8.4%. Cement consumption growth in India has remained at a healthy 812 % over the last few months. Grasims capacity additions of 8.9 mt by the FY10 end would support its volume growth and would also help in strengthening its market share, which is 18% at present.
ACC
CMP: Rs 866
Capacity expansion at Bargarh for 1.18 mtpa together with a 30 MW captive power plant is expected to be completed by CY2009. The 3 mtpa plant and a 25 MW captive power plant in Maharashtra is expected to be commissioned by the end of CY2010. Subsequently, it will have a capacity of 30.4 mtpa, which will help it in increasing the top line.
MID CAP STOCKS
Recommended By: Sharekhan & Anagram Stock Broking
MADRAS CEMENTS
CMP: Rs 110
The company has four grinding units, all in south India. The greenfield expansion at Ariyalur (TN) for an additional capacity of 2mt was completed up to the grinding level in March 2009. With this, the installed capacity at the end of FY09 went up to 10mt. The company is also upgrading one of its existing plants at RR Nagar.
PRISM CEMENT
CMP: Rs 54
It has placed an order for its core equipment with FL Smidth & Co AS, Denmark, and Koeppern, Germany, for brown-field expansion at Satna. It has targeted commissioning of plant by Sept 2010. It has acquired most of the land for mining operations. Also, it has allotted a coal block in Chindwara (Madhya Pradesh) which has been approved.
SMALL CAP STOCKS
Recommended By: ICICI Securities and Angel Broking
JK CEMENT
CMP: Rs 115
JK Cements 3-mt greenfield plant at Karnataka is likely to be commissioned in Q1FY10. The new plant will increase grey cement capac-ity by 68%. JK Cement meets 90% of its fuel requirement through petcoke. With a sharp correction in crude oil prices, petcoke prices have also declined by 49% from their peak.
JK LAKSHMI CEMENT
CMP: Rs 129
The average price realisation increased by 14.6% to Rs 3,470/tonne in the last quarter. It is setting up a 2.7mtpa greenfield cement plant in Chattisgarh by Oct 2012, taking total cement capacity to 7.5mtpa. The company is also expanding its clinker capacity at Sirohi plant by 0.33mtpa to 3.96mtpa, by Dec 2010.
Small Cap Stock Analysis - SEL Manufacturing
Here is one stock which have it's 52 week high of Rs. 757 and low of Rs. 38. It is trading at Rs. 67 currently. So, if the stock goes back to it's 52 week highs again, how much money do you think you can make? More than 10 times!! Before rushing to buy stocks of SEL Manufacturing, won't you like to understand why did this stock crashed so much? And why it didn't participated in the rally after crash in which most of the stocks have recovered to an extent? One of my visitors, Mr. Ramesh Hariharan, had suggested this stock and asked my take on this company. Let's understand if there are any chances for us to make money in this counter?
Company Background:
SEL Manufacturing Company Limited is a vertically integrated textile company that manufactures and exports cotton yarn, combed yarn, knitted fabrics and knitted garments. The Company has production facilities located in Ludhiana in Punjab and Baddi in Himachal Pradesh, India. It manufactures and exports all types of knitted garments and its main products include t-shirts, polo shirts, sweat shirts, boxer shorts and girls top.
The Company operates in four segments: readymade garments, texturized yarn, knitted cloth and cotton yarn. The Company is a 99% partner in the partnership firms, M/s SE Exports and M/s Kudu Industries. During the fiscal year ended March 31, 2008, the Company increased its stake to 99% in M/s Kudu Industries. In July 2009, the Company acquired a majority stake in SEL Textiles Pvt Ltd, thereby making it a subsidiary.

Analyzing Results
Company's income and profit has been almost doubling for past 2 years. Net profit had increased 100% in 2008 compared to 2007. In year 2009, despite of slowdown, profit increased 25% (44.85 Crores in F.Y. 2008 and 54.78 Crores in F.Y. 2009)
This growth looks attractive looking at the income and profits, so let's have a look at one of the very important factor responsible for deciding valuations of any stock. EPS. Earnings per share.
2007 : 24.04
2008 : 29.48
2009 : 31.91
EPS is increasing but at the same time equity base is also increasing. Equity base meaning number of shares issued in markets. So Earnings Per Share with respect to profits does not translates into growth similar to profit or earnings growth.
Promoters shareholding also stands at healthy 55.73%.
In last week company has acquired majority stake in SEL Textiles Pvt. Limited, thereby making it a subsidiary.
With the aforesaid acquisition of stake in SEL Textiles Pvt. Limited, the consolidated manufacturing facilities (i. e in Spinning) of SEL Manufacturing Company Limited, including the capacities under implementation under its expansion plans, would increase upto approximate 1.75 Lakh spindles + 1632 rotors for open ended spinning.
The only worrying factor is - SEL Manufacturing has large debt in it's balance sheet. And it is increasing year by year. The interest cost is eating out sizeable pie of profits thereby reducing EPS.
Total Debt:
Mar. 06 : 42.99 Crores
Mar. 07 : 136.94 Croes
Mar. 08 : 325.83 Crores
I could not get access to balance sheet of company for year 2009. So not sure how much debt company has in this year's balance sheet.
Verdict:
Textile as a sector has been in prolonged downturn for past year. Company had growth of ~10% in it's EPS. It is trading at P/E ratio of 2.10. Industry woide P/E ratio for textiles is around 9. I believe the stock did not get re-rated in recent stock market rally because of it's increasing DEBT and overall performance of textile sector.
Even if it manages to keep the same growth rate in EPS for FY 2010, EPS could be around 35. Forward P/E would come below 2 at CMP. From these calculations, stock valuations look much cheaper but stock would get re-rated only if company manages to pay off the DEBT and get rid of huge loans. If you consider the debt amount of 325 Crores, how would the company pay back such huge amount? From profits. To pay off loans of Rs. 325 Crores (this amount could be bigger in this year's balance sheet), SEL Manufacturing will need many years and till that time interest cost and loan repayment would eat out major share of profits.
If one believes in company and business, and is ready to wait for few years, and if company successfully repays it's debts, there are chances that stock could prove multibagger. For short or mid tearm, stock could give 15 - 20% returns. I do not think stock would be able to touch it's highs soon.
Market Cap 115.27
* EPS (TTM) 31.91
* P/E 2.10
* P/C 1.60
* Book Value 159.63
* Price/Book 0.42
Div(%) 10.00
Div Yield(%) 1.49
Market Lot 1.00
Face Value 10.00
Industry P/E 9.83
Small Cap Stock - Raj Packaging Industries
One of my readers Mr. Ramesh Nevada asked my opinion on this small cap stock. I found his initial information interesting about this company. Raj packaging has dividend yield of almost 8% at CMP though it is very very small company with only 5 Crores market cap at present share price. Here is my stock analysis.
 Company has a steady growth rate for past few years and it is growing slowly. The company is involved in business of providing packaging films mainly for food industry which seems to be a steady business.

Company's promoters shareholding is healthy @ 44%. The stock dividend from Rak packaging is 10% on face value, the dividend yield comes at 7.7%. It is undoubtedly good dividend yield.
If you look at the stock chart in history, it shows you the cyclical nature of stock. It has never witnessed big growth in earnings and never posted the big numbers of growth. This shows the limitations of the business from growth perspectives.
I read a news about plans of expansion in last year around month of February but did not read if it has been completed. Definitely if this is completed and if it could increase productions for the company, it would be beneficiary for company growth and ultimately for shareholders. May be this development would provide the boost in earnings and business.
Market Cap 5.36
EPS (TTM) 2.00
** P/E 6.75
P/C 4.64
* Book Value 15.46
* Price/Book 0.87
Div(%) 10.00
Div Yield(%) 7.41
Market Lot 1.00
Face Value 10.00
Industry P/E 4.02
One may buy stocks of this company for steady dividend income. But you will need to track the stock and company at regular intervals. I would recommend to buy shares at around Rs. 10 - 11 levels. The business and the stock is not a high growth stock and so do not expect exponential growth in your investments. It is a slow growth stock with good dividends, but lacks any lucrative business story.
 Company has a steady growth rate for past few years and it is growing slowly. The company is involved in business of providing packaging films mainly for food industry which seems to be a steady business.
Company's promoters shareholding is healthy @ 44%. The stock dividend from Rak packaging is 10% on face value, the dividend yield comes at 7.7%. It is undoubtedly good dividend yield.
If you look at the stock chart in history, it shows you the cyclical nature of stock. It has never witnessed big growth in earnings and never posted the big numbers of growth. This shows the limitations of the business from growth perspectives.

I read a news about plans of expansion in last year around month of February but did not read if it has been completed. Definitely if this is completed and if it could increase productions for the company, it would be beneficiary for company growth and ultimately for shareholders. May be this development would provide the boost in earnings and business.
Market Cap 5.36
EPS (TTM) 2.00
** P/E 6.75
P/C 4.64
* Book Value 15.46
* Price/Book 0.87
Div(%) 10.00
Div Yield(%) 7.41
Market Lot 1.00
Face Value 10.00
Industry P/E 4.02
One may buy stocks of this company for steady dividend income. But you will need to track the stock and company at regular intervals. I would recommend to buy shares at around Rs. 10 - 11 levels. The business and the stock is not a high growth stock and so do not expect exponential growth in your investments. It is a slow growth stock with good dividends, but lacks any lucrative business story.
Small Cap Stock To Buy With Good Dividend Yield
SUPREME Industries (SIL), one of India’s largest plastic products makers, looks a good bet for longterm investors. The company riding high on Indias growing appetite for plastic products saw its net profit treble in the quarter ended June.
It is building a 10-storey office complex on a plot owned by it in Andheri West, a prime locality in Mumbai suburbs. This will boost its profitability over the next couple of years. At the same time SILs scrip is trading at a lower price-to-earnings ratio than other big players in the industry.
BUSINESS:
Established in 1942, Supreme Industries operates 19 plants across India and produces a range of plastic products such as pipes, furniture, industrial and packaging products. In fact, it claims to have the countrys largest plastic products portfolio. The company has an annual turnover of Rs 1,650 crore and a market capitalisation of Rs 760 crore.
Plastic pipes systems accounted for 43% of its total turnover in the year ended June 2009, while industrial components, including automotive parts, brought in one-fifths of its earnings. It is also a leading player in cross-laminated films, furniture, protective packaging and material handling materials. Exports account for a negligible 5-6 % portion of its total sales. Supreme Industries has restructured its business over last couple of years by selling off unprofitable divisions and investing in the others. It divested its PVC film business at Malanpur in Madhya Pradesh, food serviceware plant in Daman and flexible film division at Pondicherry.
GROWTH DRIVERS:
The company is developing its land at Andheri (West) by constructing a 10-storey commercial complex, set to be ready by October . The project, which will offer 2.5 lakh square feet office area for sale, is coming up in a prime locality. The proceeds from this project will boost the companys earnings, while providing necessary funds to invest in its main business.
Supreme Industries achieved 29% volume growth in FY09 despite the weak economic conditions and is expected to grow by over 20% for next couple of years as well. With overall indirect taxes coming down, the demand for plastic products is growing fast in India. At the same time, additional polymer capacities coming up in the Middle East are expected to suppress the prices of polymer over next couple of years. Both developments augur well for the firms future.

FINANCIALS:
Supreme Industries has a history of steady growth with the net profits growing at a cumulative annual growth rate (CAGR) of 35.9% over the last five years, with net sales growing at 15.7%. The company has not missed a dividend in at least 15 years. Its operating cash flows also have been strong over last five years.
The company recently carried out a share buyback scheme reducing its paid-up capital by 8% to Rs 25.4 crore. Although, Supreme Industries performance during the first half FY09 was under pressure due to crash in polymer prices, it reported 90% jump in its net profit to Rs 97.4 crore for 2008-09 with the net sales growing by 26% to Rs 1651.9 crore.
Market Cap 786.80
EPS (TTM) 38.33
P/E 8.08
P/C 5.25
Book Value 134.94
Price/Book 2.30
Div(%) 80.00
Div Yield(%) 2.58
Market Lot 1.00
Face Value 10.00
Industry P/E 7.38
VALUATIONS:
At the current market price of Rs 303.5, the scrip is trading at 7.9 times its earnings for last 12 months, which is cheaper compared to its key rivals Sintex Industries (P/E of 10.3), Nilkamal (P/E of 12.3) and Time Technoplast (P/E of 14.2). We expect the company to post EPS of Rs 57.8 for the year ending June 2010, which discounts the current market price by 5.3 times. For FY10, Supreme Industries has declared a payout of Rs 12 per share, which translates in 4% dividend yield at the current market price.
Source: EconomicTimes
Apollo Tyres - Mid Cap Growth Stock
 APOLLO Tyres , the second largest player in the tyre industry, (in terms of revenues) is likely to overtake MRF to become Indias largest tyre-maker after the recent acquisition of Dutch company Vredestein Banden BV.
Inorganic growth, expansion in domestic market and improving operational efficiency make Apollo Tyres a good long-term bet for the investors.
 BUSINESS:
Apollo Tyres (ATL), the flagship company of the Raunaq Singh Group primarily engaged in manufacturing of automobile tyres, tubes and flaps had consolidated revenues of Rs 4,984 crore for the year ended March 09. It has production capacity of around 850 tonnes/day in the domestic market and 300 tonnes/day from international operations. The company is a dominant player in the commercial vehicles segment. Till FY09, the company had a 27.3% market share in truck & bus tyres and 24% share in the domestic light commercial vehicle tyres. Introduction of radial tyres in the passenger car category helped the company to increase its presence in the car segment in the recent years. The company is building up capacity for radial tyres for trucks, thus readying itself for the next generation trucks.
GROWTH PLANS:
The company has undertaken couple of overseas acquisitions in the last one year. This is as per its strategy to diversify its presence globally and generate nearly 60% of its revenues from the overseas market.
Recently in May this year, Apollo announced the acquisition of Dutch tyre-maker Vredestein Banden BV for Rs 1,200-1 ,500 crore. Apollo Tyres plans to fund this acquisition with a mix of internal accruals and debt financing. Vredestein Banden BV has a strong sales and marketing network besides a production unit in Enschede, The Netherlands with capacity of 55 lakh tyres. It will give Apollo access to the challenging European market. Revenues from Vredestein Banden BV will be reflected in Apollos accounts from the current quarter of April June 2009. The company is also planning a greenfield unit in Hungary. But this project has now been deferred due to global economic slowdown, which has hit the auto sector badly.
However, the company is bullish on the domestic demand and is making investment also expanding to tap the market in the country. To increase its presence in the radial tyres segment of commercial vehicles, Apollo Tyres has made an investment of about Rs 1,300 crore in Chennai for a greenfield project, which is likely to be operational by the end of this year. This plant, with facilities to make radial tyres for both trucks and cars, is going to have capacity of 180 tonnes/day, which can be augmented, to 450 tonnes/day depending on the demand .
On a consolidated basis, Apollo Tyres turnover is projected to reach around Rs 7,500-8 ,000 crore for the year ending March 10, making it the largest tyre company in India in terms of revenues. In 2006, Apollo Tyres had acquired Dunlop South Africa. The acquisition gave the company a strong foothold in the African continent including a sales network of branded Dunlop Zones, besides two manufacturing units in Durban and Ladysmith.
FINANCIALS:
The year ended March 09 had been a challenging year for the company. Sales growth slowed to 6% from compounded annual growth (CAGR) of 18% in the previous three years on the consolidated basis. But the positive news is that rubber price has come down and is expected to get reflected in the financials in the coming quarters. Further, with demand for automobiles improving, the company is expected to register reasonable sales growth in the coming quarters.
The industry, which registered a growth of only 2.2% for nine months ending Dec 08, has since recovered and is estimated to have recorded better demand as auto sales have improved. During the latest quarter ended June 09, Apollo Tyres topline rose 10% to Rs 1,180 crore from the year-ago level on the standalone basis. Operating profit grew 75% to Rs 194 crore, while net profit nearly doubled to Rs 94 crore.
Market Cap 1,930.41
EPS (TTM) 3.06
P/E 12.52
P/C 7.66
* Book Value 26.84
Price/Book 1.43
Div(%) 45.00
Div Yield(%) 1.17
Market Lot 1.00
Face Value 1.00
Industry P/E 13.74
VALUATIONS:
At its current market price of around Rs 38 per share, the stock is trading at 13.78 times its earnings per share (EPS) for the yearended march 09 on the consolidated basis. In contrast its closest competitor, MRF is trading at a price-to-earnings (P/E) multiple of nearly 24. Assuming a modest 12-15 % annual growth in revenues and continued improvement in operating margins, Apollo Tyres oneyear forward P/E ratio works out to around 9.4, which provides ample upside potential to long-term investors. Besides, Apollo Tyre has a dividend yield of 1.2%, which will only improve as profit grows.
Source: EconomicTimes
Small Cap Stock To Buy - Banswara Syntex Ltd
Banswara Syntex Limited has been in spinning, historically. Over time, it has stepped across the textiles value chain. Value-added businesses fetch high margins and Banswara is looking to increase its share from such products.

It started with weaving and later diversified into cotton spinning and readymade garment manufacturing.A separate unit was set up at Daman to manufacture trousers under the brand name of ‘Integration’. The production is exported to more than 50 countries including US, UK, Canada and Spain. With its plan of positioning itself as an integrated textiles company, it has taken several steps.
Recently, it installed 10 jacquard looms to make upholstery fabric and set up a new plant for readymade garments at Surat. This plant also has the capacity of producing 11,250 jackets per month. Its foray into jackets will ensure another revenue source. The share of fabric and garments in its total revenue is rising and is expected to reach 60% by 2010. While integration is the goal, its focus on the yarn business will remain unchanged. This is clear from the increase in its spinning capacity. As competition for cotton yarn business has intensified, it has converted spindles for cotton yarn spinning into blended yarn production.
The company enjoys a strong customer base. It includes Levi’s Strauss (Dockers), Marks & Spencer, Next, Perry Ellis,Liz Clairborne and domestic players like Raymond and Pantaloon. It has set up an 18MW thermal power plant in Banswara which meets 90% of its power requirements. Changing over to coal has also helped to save on fuel costs.
Market Cap 53.67
* EPS (TTM) 7.12
* P/E 5.75
* P/C 1.38
* Book Value 70.09
* Price/Book 0.58
Div(%) 12.00
Div Yield(%) 2.93
Market Lot 1.00
Face Value 10.00
Industry P/E 145.04
The March quarter has been good for the company. Sales and operating profit have grown 18% and 135%,respectively.The five-quarter average sales and operating profit growth are 27% and 42%,respectively. It operates with a margin of 13%. The most compelling reason to buy this stock are its valuations. At the current levels of Rs 40, it's market-capitalisation is 0.1 times its sales and 0.9 times its operating profit. We can’t get too many stocks at cheaper valuations than this.
A great stock to buy on declines.
Good Small Cap Stock To Buy - Sarla Performance Fibers Ltd
Sarla Performance Fibers Ltd. (formerly Sarla Polyester Ltd) is a 100% Export Oriented Unit (EOU) manufacturing Polyester, Polyamide (Nylon) Texturised yarns & conventional/air covered Lycra/Spandex yarns.
 Sarla Performance Fibers ,is one of the well established and niche companies exporting Regular as well as High Tenacity Polyester and Nylon Yarns. It started its operations 15 years back as a commodity manufacturer of Man Made Fiber. However, in the last five years, it has successfully transformed its business strategy and implemented a niche business model. It has an installed capacity of 11464 MTPA for manufacturing yarns in Silvassa and a Dyeing unit at Vapi.
The companys emphasis has been to focus on niche end user applications, higher value added yarns to leading global apparel brands and companies. While it still manufactures some commodity yarns, the major focus has been in the area of Performance Fibers. To aid the strategy further, the company has also set up a manufacturing facility under JV in 2006 in Honduras, Central America. This would enable the company to tap the North American market, the largest market for performance yarns in the world. With this JV, it now positions the company to supply the global textile majors such as Delta, Hanes Brands Inc.,Fruit of The Loom, Russell etc. due to global positioning for supplying of its products.
With the signing of the CAFTA treaty major garment and apparel companies (especially North American Companies) are shifting their manufacturing facilities to Central America resulting in this region becoming a fast growing textile manufacturing hub .The company is also amongst the very few Nylon 6 producers in the country and intend to further expand the value chain.
Market Cap 40.21
* EPS (TTM) 11.98
* P/E 4.83
P/C 3.07
* Book Value 98.51
* Price/Book 0.59
Div(%) 35.00
Div Yield(%) 6.05
Market Lot 1.00
Face Value 10.00
Industry P/E 4.18
Promoters are aggresive and they are commited to make lot of shareholders wealth in the long run.They themselves have taken warrants at 150 odd rs which speaks about their confidence in the company.Valuation wise too its quoting at lower single digit one year forward basis.
A great small cap stock to buy for the long run.
Small Cap Stock To Buy - Navin Fluorine International
Navin Fluorine International was born out of a restructuring exercise of its parent, Mafatlal Industries. It has been operating the largest integrated fluorochemical plant in India since 1967.

There are three segments to its business – speciality fluorochemicals, bulk fluoride and refrigerants. The speciality fluorochemicals are used in making agrochemicals, antibiotics for the pharmaceutical industry, pigment for the petrochemical industry and toothpaste for the personal-care industry.
 Bulk fluoride is used by aluminium companies. Two more products derived from fluorine, CFC and HCFC 22, are used in refrigeration. CFCs (chlorofluorocarbons) are used primarily as refrigerant gases, the production of which is being phased out under the Montreal Protocol. CFC is being replaced by HCFC (hydrochlorofluorocarbon) for air-conditioning and as refrigerant gases. HCFC-based gases will be phased out by 2040. HFC 134a is the next generation gas after CFC and HCFC.
Currently, Navin Fluorine imports HFC 134a and sells it in the domestic market.The company has been stagnant for the past several years. The core business of fluorine is slow. Offtake depends on sales growth of air-conditioners, aluminium products and the pharma sector. The demand for refrigerators is expected to be driven by the replacement market and higher demand from rural India, where the primary concern is availability of power rather than affordability. Refrigerant gases are also needed for car air-conditioners.
The size of the Indian pharmaceutical industry is poised to treble by 2015. This means more use of fluorine. However, Navin Fluorine has another source of cash.It will continue to get large carbon credits for phasing out CFC. HFC 23 is a designated greenhouse gas under the Kyoto Protocol which leads to the depletion of the ozone layer. Once released, it stays in the environment for 260 years, the longest staying time among all HFC-based gases. Emission of this gas is to be reduced under the Kyoto Protocol for which the company is implementing a clean development mechanism project. The project will install a system to capture, store and destroy HFC 23 by thermal oxidation. This is expected to generate 2.8 million CERs (certified emission reductions) or carbon credits annually for 10 years. For every metric tonne of carbon dioxide (CO2) cut, the project is awarded one CER. This assures a certain amount of cash flow for the next 10 years.
Given that, the stock is cheap. A great buy at sub 120 levels.
Source: MoneyLife
Market Cap 163.62
* EPS (TTM) 44.84
* P/E 3.61
P/C 2.83
* Book Value 226.75
* Price/Book 0.71
Div(%) 100.00
**Div Yield(%) 6.17
Market Lot 1.00
Face Value 10.00
Industry P/E 7.90
Buy Stocks Of Fertilizer Companies On Dips
Technical Analyst, Sudarshan Sukhani is of the view that All fertilizer stocks are buy on dips opportunities. He has recommended to buy stocks of fertilizer companies on dips in market.
Sukhani told CNBC-TV18, "All fertilizer stocks are buy on dips opportunities. It is not easy to say this dip is going to end here but certainly the focus should be on buying them. I own Nagarjuna Fertilisers."
Source: MoneyControl.com
Sukhani told CNBC-TV18, "All fertilizer stocks are buy on dips opportunities. It is not easy to say this dip is going to end here but certainly the focus should be on buying them. I own Nagarjuna Fertilisers."
Source: MoneyControl.com
Balmer Lawrie - Small Cap Growth With High Dividend Yielding Stock
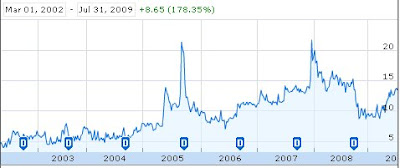
THE Rs 730-crore Balmer Lawrie (BLL), a staterun unit with mini-ratna status, is a mid-cap with long-term promise. Headquartered in Kolkata, BLL is a debt-free company with rising dividends every year. It has a healthy record of sales and profits growth, which makes it an ideal investment candidate for long-term investors.
 Business:
BLL operates in eight distinct strategic business units including industrial packaging, greases & lubricants, logistics services, engineering & technology, logistics infrastructure, travels & tours, leather chemicals and tea.
The company is India’s largest producer of metal drums used in packaging chemicals and lubricants. Travel & tours services bring in the major share of revenues, while the logistics services account for the highest profits. The company has a wholly-owned subsidiary in the UK carrying out logistics business.
Balmer Lawrie Investments (BLIL), which is 59.67% owned by the government of India, holds a 65.7% stake in the company. It was created in 2001 with a view to divest the government’s stake in Balmer Lawrie. The new UPA government, which is considering selling stakes in profitmaking PSUs, may look at BLL as a divestment candidate as it is a non-core, but profitable, public sector firm.
Growth Drivers:
Balmer Lawrie is a debt-free, steadily growing company with strong presence in all the industries in which it operates. The company has plans to grow inorganically by acquisitions in the areas of travels & tours and logistics and has a budget of Rs 100 crore for this.
During the past five years, the company has grown at a cumulative annual growth rate of 12.6% at topline to Rs 2,007 crore for the year ended March 2009, with the PAT growing at a CAGR of 28.8%. BLL has a strong track record of paying dividends, and during the period its dividend payout has increased at a CAGR of 41.7%
Financials:
The global financial slowdown hasn’t left Balmer Lawrie untouched. Its operating performance stagnated in FY09 and the net profit was propped up by a spurt in nonoperative income. Revenues went up 13.7% in FY09 at Rs 2,007 crore and profits grew by 9.3% to bring in Rs 109 crore.
The services sector did well during the year with travels and tours posting 19% growth and logistics services growing at 21%. Both these businesses posted healthy improvement in profits as against a fall in profit for manufacturing businesses such as industrial packaging and lubricants. With established businesses and very low annual capex, the company has maintained its return on employed capital to beyond 40% for last four years.
Market Cap 756.90
EPS (TTM) 62.39
P/E 7.45 * P/C 6.75
* Book Value 261.85
Price/Book 1.77
Div(%) 170.00
Div Yield(%) 3.66
Market Lot 1.00
Face Value 10.00
Industry P/E 20.03
Valuations:
The company’s current market capitalization of Rs 728.5 crore is just 6.7 times its annual profit of the year ended March 2009, out of which Rs 150 crore is represented by cash equivalent. The dividend yield works out to 4.5%. We expect the company to post an EPS of Rs 77 in FY10, which discounts the current market price by 5.7 times.
 Business:
 BLL operates in eight distinct strategic business units including industrial packaging, greases & lubricants, logistics services, engineering & technology, logistics infrastructure, travels & tours, leather chemicals and tea.
The company is India’s largest producer of metal drums used in packaging chemicals and lubricants. Travel & tours services bring in the major share of revenues, while the logistics services account for the highest profits. The company has a wholly-owned subsidiary in the UK carrying out logistics business.
Balmer Lawrie Investments (BLIL), which is 59.67% owned by the government of India, holds a 65.7% stake in the company. It was created in 2001 with a view to divest the government’s stake in Balmer Lawrie. The new UPA government, which is considering selling stakes in profitmaking PSUs, may look at BLL as a divestment candidate as it is a non-core, but profitable, public sector firm.
Growth Drivers:
Balmer Lawrie is a debt-free, steadily growing company with strong presence in all the industries in which it operates. The company has plans to grow inorganically by acquisitions in the areas of travels & tours and logistics and has a budget of Rs 100 crore for this.
During the past five years, the company has grown at a cumulative annual growth rate of 12.6% at topline to Rs 2,007 crore for the year ended March 2009, with the PAT growing at a CAGR of 28.8%. BLL has a strong track record of paying dividends, and during the period its dividend payout has increased at a CAGR of 41.7%
Financials:
The global financial slowdown hasn’t left Balmer Lawrie untouched. Its operating performance stagnated in FY09 and the net profit was propped up by a spurt in nonoperative income. Revenues went up 13.7% in FY09 at Rs 2,007 crore and profits grew by 9.3% to bring in Rs 109 crore.
The services sector did well during the year with travels and tours posting 19% growth and logistics services growing at 21%. Both these businesses posted healthy improvement in profits as against a fall in profit for manufacturing businesses such as industrial packaging and lubricants. With established businesses and very low annual capex, the company has maintained its return on employed capital to beyond 40% for last four years.
Market Cap 756.90
EPS (TTM) 62.39
P/E 7.45 * P/C 6.75
* Book Value 261.85
Price/Book 1.77
Div(%) 170.00
Div Yield(%) 3.66
Market Lot 1.00
Face Value 10.00
Industry P/E 20.03
Valuations:
The company’s current market capitalization of Rs 728.5 crore is just 6.7 times its annual profit of the year ended March 2009, out of which Rs 150 crore is represented by cash equivalent. The dividend yield works out to 4.5%. We expect the company to post an EPS of Rs 77 in FY10, which discounts the current market price by 5.7 times.
Shreyans Industries Limited - Small Cap Stock To Buy With Huge Upside Potential
This year’s cash flow of Shreyans Industries is more than its market-cap! have a look at Shreyans Industries Limited (SIL), a stock which looks extremely attractive at its current valuations & decide wheather it's a stock to buy or not.
 India currently consumes 8.50 million tonnes of paper; this is expected to go up to 10 million tonnes by 2010 and 15 million tonnes by 2015, a growth driven by increased spending on education, higher literacy levels, improved standards of living, an expanding retail sector and increase in packaging and advertise-ment expenditure. Paper manufacturing is, however, a very capital-intensive business with a long gestation period. This gives the already established units an upper hand when the economy emerges from a slowdown.
SIL has a capacity to manufacture 60,000 tonnes of writing & printing paper at its two facilities, Shreyans Papers and Shree Rishabh Paper. It also manufactures soda ash but has only a small capacity for this.
SIL is basically an agro-based company. Its main raw material is straw/grass. Its financial performance has been improving consistently over the past three years. In FY08, it produced a total of 61,122 tonnes of paper as against 58,954 tonnes manufactured in the preceding year. Its turnover was up 11% at Rs238.64 crore as against Rs214.33 crore during the preceding year. Better realisations in paper as well as soda ash have improved its margins and profitability. It reported a 7% rise in its operating profit during FY08. A marginal increase in depreciation and 7% saving in interest cost enabled it to record 51% increase in its profit before tax. Despite a one-time provision of Rs5.80 crore (amount paid to banks for debt restructuring), net profit was up 82%. The company has commissioned a 3.5MW co-generation plant at one of its plants last fiscal. Its earning per share for FY08 was Rs10.88 and, since it carries forward its previous losses, its tax provision is limited to only the deferred taxes that it has to pay. The result was Rs23.90 crore of cash profits translating into cash EPS (earning per share) of Rs21.60.
Now look at its recent performance. For the first nine months of the current year, its sales were up 11% compared with the corresponding year-ago period while its profit before tax shot up 41% to Rs21.32 crore. Its profit after tax was up 52% to Rs13.22 crore from Rs8.67 crore during the corresponding period last year. In fact, its nine-month profit for the current fiscal has already surpassed its full-year profit for the last year.
The company is setting up another 5MW co-generation power plant (estimated cost: Rs25 crore) at its second factory. This plant, likely to be commissioned by April 2009, is expected to bring about significant energy savings. Its power plant is also entitled to carbon credits. It has recently issued 6.90 lakh warrants to promoters and 20.60 lakh warrants to non-promoters which will be converted into equity shares @ Rs32.50 in FY10.
What can you expect from this company? For FY09, Shreyans is likely to achieve a turnover of Rs270 crore and earn a net profit of Rs18.50 crore translating into an EPS of Rs16.70. The June quarter is expected to be even better as it would save on its power costs significantly when its second co-generation plant gets commissioned and the resultant carbon credits that it would begin to earn by then.
Market Cap 35.38
EPS (TTM) 16.36
P/E 1.95
P/C 1.42
* Book Value 42.47
Price/Book 0.75
Div(%) 0.00 Div Yield(%) -
Market Lot 1.00
Face Value 10.00
Industry P/E 6.28
According to our estimates, the company could register a 20% growth in profit in FY10. Currently trading at Rs18, the stock is priced at just 1.50 times its FY09(E) EPS making it extremely attractive even under the present market conditions. Its market-cap currently stands at Rs20.04 crore – a level which is less than its annual cash profit! This means that the stock is currently trading at less than one time its FY09 cash EPS. An excellent low-priced stock to buy for decent appreciation in the medium term.
Source: MoneyLife
Castrol India Ltd - Stable Mid Cap Stock To Buy
 Castrol India is the Indian subsidiary of UK-based Burma Castrol and is engaged in manufacturing and marketing of automotive and industrial lubricants and specialty products.
It operates in the automotive as well as non-automotive segments. The former includes oils for heavy-duty vehicles, cars, motorcycles and bikes, while the latter includes industrial lubricants, marine and energy lubricants and the services segment.Public sector players like IndianOil, Bharat Petroleum (BPCL) and Castrol account for around 70% of the domestic lubricants market.
Several other players, including global majors, account for the balance share, resulting in a highly competitive market. Besides having technologically superior products, Castrol also has strong distribution network and brand recall. The company is the market leader in the retail segment with a share of around 21% in the total automotive lubricants market.Castrol has gained market share in a declining lubricants market.
The entry of new original equipment manufacturers (OEMs) offering new technology vehicles will provide additional opportunities for the company's products. Lube consumption is projected to grow strongly in cars, four-stroke bikes, as well as building and construction equipment segments. Gradual growth in personal mobility, as well as corresponding growth in demand for automotive services, are positive factors for the company in the long term.
Castrol seeks revenue and value growth through higher dependence on superior technology products relevant to new generation of vehicles, as well as focus on volume growth in the key growth sectors which it has identified. Rather than a broad volume growth strategy, the company is looking at building on profitability. In the past five years, there has been a dramatic increase in the number of cars and commercial vehicles on India's roads. This aftermarket is likely to be a big growth driver for the lubricant industry in general and Castrol in particular, over the next few years.Even amidst a slump in the automobile sector, the company's lubricants will still have a large potential market to tap.
Market Cap 4,647.02
EPS (TTM) 21.49
P/E 17.49
P/C 15.95
* Book Value 38.46
Price/Book 9.77
Div(%) 150.00
Div Yield(%) 3.99
Market Lot 1.00
Face Value 10.00
Industry P/E 16.93
A ROBUST balance sheet, sound business model and strong brand equity of its products is enabling Castrol India to churn out good cash flows year after year. The stock is fairly valued at current multiples. Besides, a high stock dividend yield, stable business and sound financials make the stock an attractive pick for the long term investing.
Force Motors Ltd - Small Cap Today ... Large Cap Tomorrow?
Force Motors Limited, A Firodia Enterprise, is a Company that has reinvented itself. Four decades ago, Force Motors started production of the HANSEAT 3-Wheelers in collaboration with Vidal & Sohn Tempo Werke Germany and went on to establish a strong presence in the “Light Commercial Vehicles” (LCV) field with the MATADOR. The proverbial LCV in India.

Through the 80s and 90s, especially in the last 5 years with a major product development effort, Force Motors has introduced new Light Commercial Vehicles, a new family of Utility Vehicles, new state-of-the-art Tractors, and a new range of Three-Wheelers.
Today Force Motors stands on the threshold of a new era in the automobile industry in India, with a stake in Five Product segments :

TRACTORS - OX and Balwan - Modern Tractors , sporting synchromesh transmission , Bosch hydraulics, excellent ergonomics and fuel efficient engines. Designed for demanding farmers of developing countries.
THREE WHEELERS - Minidor . A family of new and beautifully engineered three- wheelers - economical, rugged and environment friendly - very efficient transport for people and goods.
LIGHT COMMERCIAL VEHICLES - Traveller and Excel range of passenger & goods carriers. Powered by a family of DI and IDI engines including the legendary Mercedes derived OM 616 engines. A range of high reliability axles and transmissions add value.
MULTI UTILITY VEHICLES - Complete range of multi utility vehicles including the Trax Judo, Trax GAMA, Trax Cruiser, Trax Kargo King, range of single cabin and double cabin pickups. And the 4X4 cross country vehicle - Trax Gurkha.
HEAVY COMMERCIAL VEHICLES - In technical collaboration with MAN AG, Germany, Force Motors will be introducing shortly a range of heavy commercial vehicles with a payload capacity ranging from 16 to 50 tonnes.
FORCE Motors' recent announcement to convert its joint venture (JV) with MAN Nutzfahrzeuge AG of Germany into an equal JV is a welcome break for the beleaguered shareholders of Force Motors. In the past five years, the company has failed to grow its topline despite a boom in the commercial vehicle segment.
Moreover, it has been posting losses since FY07. The earlier 70:30 JV with MAN-Man Force Trucks (MNF) is yet to show any significant activity, despite being three years old now. Its decision to allow MAN to raise its stake in MNF to 50% is likely to give a fresh lease of life to the JV, besides providing its parent company, Force Motors, with the much-needed cash.
Under the deal, Force Motors will sell 14.2% stake in MNF to MAN for a consideration of Rs 300 crore. MAN will acquire additional equity through a rights issue worth Rs 250 crore to raise its stake to 50%. The deal values MNF at over Rs 2,000 crore. In contrast, Force Motors' current market capitalisation is a little over Rs 140 crore. The move shows MAN's commitment to the JV and the importance it attaches to its success in the domestic market.
India is among the world's top four markets for commercial vehicles and MAN is seeking a significant pie of this growing cake. The Germany-based automotive and engineering major is one of Europe's leading truck makers. An equal stake will allow MAN to play a leading role in the company's management and may turn out to be a turning point for the fortunes of Force Motors' investors.
Market Cap 131.10
EPS (TTM) 104.83
P/E 0.95
P/C 0.74
Book Value 78.14
Price/Book 1.27
Div(%) 0.00
Div Yield(%) -
Market Lot 1.00
Face Value 10.00
Industry P/E 18.57
One must consider buying stocks of Force if he/she is long term investor in market and believes in concept of Turnaround story. This small cap could become mid cap and who knows a large cap tomorrow, though only in long term.
Sector Analysis - Tyre Manufacturing & Best Stocks
The tyre industry, which was reeling under a slowdown in demand till December ‘08, is likely to show signs of improvement in the coming quarters. With the price of rubber, a key raw material, easing off and uptick in demand from passenger cars, tyre makers are likely to register a better growth this year.
 The positive signs have already started reflecting in the industry, which is estimated to have grown 4.27% in terms of tonnage production for ‘08-09. This shows that there has been a sharp growth in the quarter ended March ‘09 as the industry had registered production growth of just 2.19% in the first nine months of FY09 as against a growth of 7.4% during April-December ‘07.
INDUSTRY STRUCTURE
The tyre industry is pretty consolidated with the top six companies accounting for 87% of the industry’s tonnage production, largely dominated by Indian firms. MRF, with 22.4% market share, is the leader, marginally ahead of Apollo Tyres’ 21.4% in terms of tonnage production .JK Tyre & Inds is the third largest player and has consolidated its position in the off-the-road tyre (OTR) category, which is essentially custommade products with high margins.
Domestic tyre makers derive a little more than half of their sales from the replacement market (55%), followed by OEM tyres (29.8%) which are essentially tyres sold directly to automobile firms. The balance is accounted by exports.
Besides exporting, many Indian tyre companies are also setting up manufacturing footprint overseas as part of a global expansion drive. For instance, Apollo Tyres, which acquired Dunlop in South Africa three years ago, has recently struck another deal. It snapped Dutch firm Vredestein Banden to increase the penetration in the European markets. Similarly, JK Tyre & Inds acquired a Mexican company Tornel in ‘08 to make further inroads in the North and South American tyre market.
FINANCIAL
The tyre industry had a smooth ride till FY08, in line with a booming economy. The industry’s tonnage production registered a compounded annual growth rate (CAGR) of 8.02% between FY03-FY08.
An analysis of the top six companies in the tyre sector shows that the aggregate sales growth has slipped from double-digit growth during Q408 to 7% for the quarter ended March ‘09. This is attributed to a decline in demand from the automobile sector and general slowdown in the Indian market. Though auto sales have improved over the last four months, it is yet to reflect in tyre sales due to the lag effect.
Profits have declined 19% for the six companies compared to robust growth of 76% recorded for the quarter ended March ‘08. This is largely due to slower topline growth and higher increase in non-operational costs such as interest expenses on borrowed capital and depreciation.
But, raw material prices, which account for close to two-thirds of the total production costs, have eased off. Rubber prices declined 20% to Rs 97.85/kg in May ‘09 from Rs 122.62/kg last year. As a result, the input price pressure experienced in the first half of ‘08-09 moderated in Q3 and Q4 of FY09. This allowed the top firms to maintain operating profit margin (OPM) of 11% despite slower sales growth.
Although input cost pressures have come off their peak, interest outgo still remains an issue with interest cost moving up 30% during the quarter despite the central bank announcing cuts in key benchmark rates which is yet to be passed on fully by the banks. Higher depreciation allowance, which grew 19%, was another factor, which ate into net margins. This indicates addition of more fixed assets by these top tyre companies. Further, since this is a noncash expenditure, it provides companies with the much needed liquidity.
Among the individual players, MRF is the only firm, which managed to grow net profit. The South-based tyre maker registered a 5% growth in net profit to Rs 68 crore for the quarter ended March ‘09. Other players like Apollo Tyres, JK Tyre & Inds and Ceat registered a decline in profit on account of lower sales growth and higher non-operational expenses.
Given the problems being faced by the industry, the government has announced excise duty cut in two tranches. The first cut in December ‘08 brought down excise duty from 14% to 10%, which was subsequently reduced to 8% in February ‘09.
This has had a positive impact on tyre scrips in the stock market. In the recent bull-run, which started in March ‘09, most auto companies have outperformed the market benchmark index, the Sensex. Moreover, in tandem, major tyre companies have also outperformed the Sensex.
OUTLOOK
Demand from the OEM segment is likely to improve due to the increase in demand from passenger cars but overall demand could remain under pressure in the short term unless the replacement market picks up. As per estimates of credit rating agency CARE, the industry is likely to post production growth of 6.81% in FY10 which is projected to result in a CAGR of 8.21% between FY08-FY13. This assumes strong replacement demand going forward.
 On the bottomline front, reduction in rubber prices and expected decline in interest rates will act as a silver lining in the coming quarters and if demand supports the topline growth, it could translate to healthy earnings growth for the companies.
Investors can adopt a wait and watch policy for stocks of Ceat and JK Tyre & Inds. But MRF and Apollo Tyres are the companies to watch out for in the industry, as these stocks are available with an attractive valuation.
Source: EconomicTimes
Subscribe to:
Posts (Atom)